As if anyone expected less than one of the most ridiculous beats ever.
Some amusing Q1 over Q2 comparisons:
- Equity Underwriting: $48 million vs $736 million
- Equities Trading (not commissions): $1,027 vs $2,157 million
- Total Trading and Principal Investments: $5,706 vs $9.322 million
- ICBC: ($151) vs $948 million
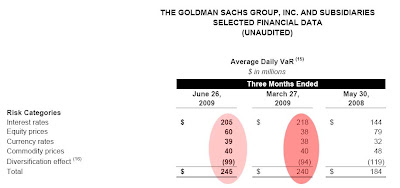
Notable: VaR hits what looks like another record high at $245 million, higher by $5 million from the last March record. Also, the fudge "diversification factor" is almost at $100 million: excluding it the company has a VaR of almost $345 million. One can barely hold their breath to see the number of $100 MM+ trading days in the quarter.
Also, for those curious what comp will be like at Goldman, here is some color:
Compensation and benefits expenses (including salaries, estimated year-end discretionary compensation, amortization of equity awards and other items such as payroll taxes, severance costs and benefits) were $6.65 billion, which was higher than the second quarter of 2008, primarily due to higher net revenues. The ratio of compensation and benefits to net revenues was 49% for the first half of 2009. Total staff decreased 1% during the quarter.
FYI: $6.65 billion for the quarter, $4.712 billion for Q1, annualized this is $22.7 billion, divided by 29,400 employees, means an average comp of $772,925/employee. Enjoy, dear taxpayer.
Sphere: Related Content Print this post


