Saturday, May 30, 2009

Saturday Readings

  • Commercial Real Estate - The economy's anvil (Time)
  • First ever global housing-led recession (Dr Housing Bubble)
  • Ralph Nader: Obama's GM plan looks like a raw deal (WSJ)
  • GM bondholders near deadline to accept equity plan (Reuters and NYT)
  • Niall Ferguson: how economists can misunderstand the crisis (FT)
  • The inefficient capital markets hypothesis (Credit Slips)
  • My therapeutic rant on the current economic madness (EconoSpeak)
  • Emir of Qatar still studying stake in Porsche (Reuters)
  • Zoellick warns stimulus "sugar high" won't stem unemployment (Bloomberg)
  • Putting a price on leaving the TARP (Dealbook)
  • How laypeople and experts misperceive the effect of economic growth (Journal Of Econ Psychology, h/t Paul Kedrosky)
  • Apollo units wins dismissal from Texas trial over Huntsman bid (Bloomberg)
Sphere: Related Content

Roubini On The Failure To Predict Financial Crises

A very insightful video from the Perimeter Institute in which Nouriel lectures on his interpretation of the lack of vision of bubble participants, as well as the implicit bubble-creation facilitation by regulators and economists.

Definitely worth watching.

Sphere: Related Content

Overallotment: May 29

  • Pravda, yes, Pravda: American capitalism gone with a whimper (Pravda)
  • Manipulation: How markets really work (Baltimore Chronicle)
  • Banks' appraisal conflicts could continue under new HVCC rules (Implode-O-Meter)
  • Gonzalez theater continues: will "decide" on Chrysler-Fiat deal on Monday (Reuters)
  • Canadian/Russian Magna picked for Opel/GM savior (WSJ)
  • Fortress seemingly hoping to become a Bank Holding Company by purchasing one, become eligible for taxpayer rescue (Bloomberg)
  • Gordian's Kaufman on a GM bankruptcy (Dealscape)
  • Reserve management clears Treasury Fund (WSJ)
  • NY AG wins court OK staying SEC pension case (Reuters)
Sphere: Related Content

Friday, May 29, 2009

FDIC's Deposit Insurance Fund Reserve Ratio Plunges To 0.27% Of Deposits

The FDIC's Deposit Insurance Fund has plunged to an all time low of just $13 billion as of March 31, or 0.27% of $4.8 trillion in insured deposits. It is worth nothing that since March 31, 15 new banks have failed which includes the biggest one so far this year, BankUnited (which Marla has a special fondness for in her heart and will be providing some ongoing entertainment on). It is thus safe to say that the $13 billion has been spent in the past 2 months, especially since banks no longer issue debt under the TLGP (of which, nonetheless, there was $336 billion outstanding at March 31 - somehow when banks are talking about repaying TARP, their FDIC-guaranteed debt, by far the biggest crutch to the banking system, is conveniently never mentioned) and therefore no longer pay FDIC guaranteed debt issuance associated fees. For many more thoughts on this phenomenon, go here.


Also, DIF-Insured deposits have hit an all time record high of $4.8 trillion, an increase of $90 billion from December 31 as depositors have been seeking a safe haven from the market in Q1. It is unknown if they would have done so, had they known their "insured" deposits will cover only the first 0.27% of depositors if there is another bank failure tsunami. As there is only one more month left in Q2 it will be curious to see it there will be a rotation out of deposits into investments at June 30, concurrent with the time we will know what the current level on the DIF is. Of course, as this data will be available some time in September, by then it may be completely worthless as one would imagine at some point the mystical futures buying force, end of month convenient fund deleveraging, or whatever else you want to call it, will have finally exhausted its market pulling strength.


Sphere: Related Content

RIEF Underperforms S&P 4.72% In May, 31.81% Since March

As the title implies, the siege on Jim Simons fort has entered the endspiel: (g)RIEF has now underperformed the S&P 500 by 31.81% since the beginning of March.

Time to go gentle into that good, if cigarette smoke filled, night? Sphere: Related Content

Lazard's Lehman-Related Expense Detail

Bankruptcy court fee applications always make for a fun read: the hundreds of thousands of dollars in Seamless Web orders, the same analyst ordering dinner 3 times a night, the $200 car service bills (with pick up and drop off address detail), the hotel minibar and porn Payperview bills, the occasional $5,000 one way airplane trip: all your dirty underwear for the world to see. As a good example I present the most recent expense detail application filed by Lazard in connection with the firm's work done in the Lehman bankruptcy case. Of course, in this case it is merely the creditors who are footing the bill. As such the material is at best fit for Page 6.

Zero Hedge will be focused much more on the expense detail statements for firms such as Capstone and Greenhill, who are advising Chrysler and getting paid by the U.S. taxpayers, and also on whoever the financial advisors for Government Motors end up being: any transgressions will be promptly noted and disclosed for public ridicule.

And in addition to the other, more mundane and traditional expense-code violations where associates back fill a dinner at Nobu by adding on 20 different non-present people who at $30 per the maximum, comfortably allowing the staffer to impress his date with the $200 tip, the following more serious item is actually quite interesting: maybe someone can explain just what Lazard was doing on July 24 and 28th subcontracting a consulting project with E&Y called "Take Pub Bnk Private." Is there a way to get just a little more clairity on what this "project" entailed, who ordered it and, most relevantly, who shut it down?


Sphere: Related Content

Weekly Credit Market Summary: May 29 - The Week In Credit

Spreads were tighter in the US this week as all the indices improved. Indices typically underperformed single-names with skews mostly narrower (as curves steepened and high beta outperformed low beta) as IG underperformed but narrowed the skew, HVOL underperformed but narrowed the skew, ExHVOL intrinsics beat and narrowed the skew, XO underperformed but compressed the skew, and HY outperformed but narrowed the skew.

The names having the largest impact on IG are American International Group, Inc. (-272.37bps) pushing IG 1.24bps tighter, and Pfizer Inc. (+3.5bps) adding 0.03bps to IG. HVOL is more sensitive with American International Group, Inc. pushing it 5.5bps tighter, and Caterpillar Inc. contributing -0.07bps to HVOL's change today. The less volatile ExHVOL's move today is driven by both National Rural Utilities Cooperative Finance Corporation (-65.63bps) pushing the index 0.66bps tighter, and Pfizer Inc. (+3.5bps) adding 0.04bps to ExHVOL.

The price of investment grade credit rose 0.41% to around 98.39% of par, while the price of high yield credits rose 2.005% to around 81.63% of par. ABX market prices are lower by 0.61% of par or in absolute terms, 1.75%. Broadly speaking, CMBX market prices are lower by 1.72% of par or in absolute terms, 0.54%. Volatility (VIX) is down 3.71pts to 28.92%, with 10Y TSY selling off (yield rising) 1bps to 3.46% and the 2s10s curve flattened by 2.1bps, as the cost of protection on US Treasuries rose 5.49bps to 48bps. 2Y swap spreads widened 0.1bps to 40.75bps, as the TED Spread widened by 4bps to 0.53% and Libor-OIS deteriorated 0.2bps to 45.5bps.

The Dollar weakened with DXY falling 0.88% to 79.257, Oil rising $4.82 to $66.49 (outperforming the dollar as the value of Oil (rebased to the value of gold) rose by 5.43% today (a 6.94% rise in the relative (dollar adjusted) value of a barrel of oil), and Gold increasing $21.7 to $979.05 as the S&P rallies (918.1 3.75%) outperforming IG credits (137.63bps 0.42%) while IG, which opened the week wider at 150bps, underperforms HY credits. IG11 and XOver11 are -9.83bps and -27.66bps respectively while ITRX11 is -3.66bps to 120.5bps.

The majority of credit curves steepened as the vol term structure steepened with VIX/VIXV decreasing implying a more bearish/more volatile short-term outlook (normally indicative of short-term spread decompression expectations).

Dispersion fell 25.7bps in IG. Broad market dispersion is a little greater than historically expected given current spread levels, indicating more general discrimination among credits than on average over the past year, and dispersion decreasing more than expected this week indicating a less systemic and more idiosyncratic narrowing of the distribution of spreads.

73% of IG credits are shifting by more than 3bps and 57% of the CDX universe are also shifting significantly (more than the 5 day average of 47%). The number of names wider than the index stayed at 41 as the week's range fell to 14bps (one-month average 23.5bps), between low bid at 137 and high offer at 151bps and higher beta credits (-8.46%) outperformed lower beta credits (-6.48%).

In IG, wideners were outpaced by tighteners by around 5-to-1, with only 7 credits notably wider. By sector, CONS saw 5% names wider, ENRGs 6% names wider, FINLs 5% names wider, INDUs 0% names wider, and TMTs 13% names wider. Focusing on non-financials, Europe (ITRX Main exFINLS) underperformed US (IG12 exFINLs) with the former trading at 120.88bps and the latter at 111.92bps.

Cross Market, we are seeing the HY-XOver spread compressing to 332.43bps from 379.64bps, and remains below the short-term average of 367.56bps, with the HY/XOver ratio falling to 1.46x, below its 5-day mean of 1.49x. The IG-Main spread compressed to 17.13bps from 22.86bps, and remains below the short-term average of 21.04bps, with the IG/Main ratio falling to 1.14x, below its 5-day mean of 1.17x.

In the US, non-financials outperformed financials as IG ExFINLs are tighter by 9.1bps to 111.9bps, with 91 of the 104 names tighter. while among US Financials, the CDR Counterparty Risk Index fell 1.64bps to 150.15bps, with Banks (worst) tighter by 4.45bps to 181.65bps, Finance names (best) tighter by 38.23bps to 681.66bps, and Brokers tighter by 7.97bps to 180.83bps. Monolines are trading tighter on average by -40.87bps (1.24%) to 2549.85bps.

In IG, FINLs underperformed non-FINLs (7.83% tighter to 8.53% tighter respectively), with the former (IG FINLs) tighter by 31.6bps to 326.7bps, with 20 of the 21 names tighter. The IG CDS market (as per CDX) is 11.8bps cheap (we'd expect LQD to underperform TLH) to the LQD-TLH-implied valuation of investment grade credit (125.87bps), with the bond ETFs underperforming the IG CDS market by around 1.3bps.

In Europe, ITRX Main ex-FINLs (outperforming FINLs) rallied 4.76bps to 120.88bps (with ITRX FINLs -trading sideways- weaker by 0.77 to 119bps) and is currently trading tight to its week's range at 0%, between 128.81 to 120.88bps, and is trading sideways. Main LoVOL (sideways trading) is currently trading at the wides of the week's range at 77.22%, between 86.93 to 82.5bps. ExHVOL outperformed LoVOL as the differential compressed to -3.04bps from 2.32bps, and remains below the short-term average of 0.73bps. The Main exFINLS to IG ExHVOL differential compressed to 38bps from 38.95bps, and remains below the short-term average of 38.51bps.

Commentary compliments of www.creditresearch.com

Index/Intrinsics Changes

CDR LQD 50 NAIG091 -12.53bps to 165.86 (2 wider - 43 tighter <> 33 steeper - 16 flatter).

CDX12 IG -9.38bps to 137.63 ($0.41 to $98.39) (FV -12.7bps to 146.15) (7 wider - 111 tighter <> 92 steeper - 33 flatter) - Trend Tighter.

CDX12 HVOL -27.03bps to 311 (FV -32.22bps to 365.19) (0 wider - 30 tighter <> 21 steeper - 9 flatter) - Trend Tighter.

CDX12 ExHVOL -3.81bps to 82.88 (FV -7.04bps to 83.66) (7 wider - 88 tighter <> 24 steeper - 71 flatter).

CDX11 XO -8.2bps to 318.2 (FV -12.76bps to 411.73) (7 wider - 27 tighter <> 19 steeper - 15 flatter) - Trend Tighter.

CDX12 HY (30% recovery) Px $+2.01 to $81.63 / -74.9bps to 1056.4 (FV -69.19bps to 978.37) (28 wider - 69 tighter <> 57 steeper - 41 flatter) - Trend Tighter.

LCDX12 (65% recovery) Px $+1.53 to $81.75 / -93.27bps to 939.04 - Trend Tighter.

MCDX12 +2bps to 180bps. - No Trend.

CDR Counterparty Risk Index fell 1.64bps (-1.08%) to 150.15bps (8 wider - 7 tighter).

CDR Government Risk Index rose 4.04bps (6.61%) to 65.19bps..

DXY weakened 0.88% to 79.26.

Oil rose $4.82 to $66.49.

Gold rose $21.7 to $979.05.

VIX fell 3.71pts to 28.92%.

10Y US Treasury yields rose 1bps to 3.46%.

S&P500 Futures gained 3.75% to 918.1.

Sphere: Related Content

Goldman Sachs Principal Transactions Update: Collapse In Agency Program Trading Volume

In the week ended May 22, NYSE program trading dropped to a statistically significant low of 2.9 billion shares, down from 3.3 billion the week before, and from a 3.8 billion prior 52 week average. As for specific actors, no surprise, Goldman leading the government's SLP team with a 7:1 ratio of principal to facilitation/agency.


As for today's market close, with a literally parabolic jump in the last minute of trading, if anyone still thinks this market trades based on anything resembling normal behavior (unless someone had a very Jerome Kerviel-esque fat delta hedging finger or one/two moderate/large quants who had a huge index hedge imploded), I have some BBB+ rated CMBS to sell to you at par. One culprit could be hiding in the huge drop of agency trading, which this week dropped to a several month low of 1.875 billion shares.


So as essentially no institutional or retail clients are trading any more, it is just a few desperate computers trying to front run each other. And, of course, for the biggest beneficiary of this PT principal bonanza, look no further than the chart below.


Going back to today's ridiculous close, the chart below shows it all: the complete tape painting volume spike at the very end of the day speaks for itself. And as computers now simply issue forced stock recall orders to each other, painting the tape wet with manipulative intent and volume spikes into the last 20 minutes of trading every day, their human creators are left on the sidelines, trying to outshout each other as to the reason for why the market keeps rising while the economy keeps tumbling.


Is there ever going to be any transparency in this market again? Sphere: Related Content

Gettelfinger Does Not Expect GM Warrants To Ever Be In The Money

Gettelfinger discussing the 2.5% warrants that the UAW has received in GM and snickering - "$75 Billion Dollars in equity for the company!? We did not put a lot of emphasis on the 2.5% warrants, let me put it that way." As he shakes his head on whether he expects GM to ever get that kind of equity valuation.

Bondholders waiting for their warrants to be worth anything may want to find a flux capacitor and go to the year 10,000.

Which leads to the more pertinent question: obviously the (worthless) warrants were not the reason for the ad hoc committee to switch sides here... Did S-Rat have some highly persuasive conversations with Houlihan Lokey and the committee members? Inquiring minds dying to know.

Full (low quality) clip below.

Sphere: Related Content

Bloomberg's Vendetta With Geithner/TALF Continues

Zero Hedge is all about subliminal mass manipulation. Which is why we cackle with delight at the ongoing subversive campaign by the most respected financial platform to debunk TALF for the massive taxpayer subsidized handout to the mega wealthy that it truly is. Continuing the LTRA humor which we brought to you yesterday, which is either the product of an angry (soon to be former) staffer, or a very directed political campaign by Mike Bloomberg himself, are the following panels which on any other day I would have thought originated from Jon Stewart. To quote Homer Simpson, "it's funny cause it's true."

Sphere: Related Content

Guest Post: The Good, The Bad And The GDP

Submitted by Phil of Phil's Stock World

Clearly there are people who will do anything for money.

In the classic movie, "The Good, the Bad and the Ugly," the characters all lie, cheat, steal and kill as they chase after a chache of government gold. They all kill, they all try to kill each other and the only character trait they all share is that will all do anything for money. We are lucky enough to have a modern version of that, with our own government supplying GOLDman Sachs and other bad market manipulators with TARP money, which they are using to, not to lend money to the good citizens of the US but rather to prop up the commodities market, stealing Billions of dollars from the very people they claimed they were going to help.

Since the November bail-out, consumer lending had gone down, home foreclosures have gone up, unemployment has gone up, housing has gone down yet the CRB has gone up 25%, led by oil, which is up 88% at $66 this morning. $66 oil is a noose around the neck of this economy as the it was cheaper oil that helped us begin to recover as it stayed around $40 from November through the beginning of March. On a per barrel basis alone, that was $500M a day LESS than we are paying now but, despite the fact that oil is still 54% in price from this time last year, gasoline has gone up so fast that it’s only down 23% from the prices that knocked the wheels out from our economy. Including refined products, that extra $26 a barrel is costing US consumers $1Bn a day, $365Bn a year or 1/2 of the TARP money going straight out of our economy and back to the countries that fund terrorism through the very ugly hands of GS (who are partners in ICE) and other TARP recipients who have funded and coordinated this commodity "rally," screwing the American people over with our own tax dollars.

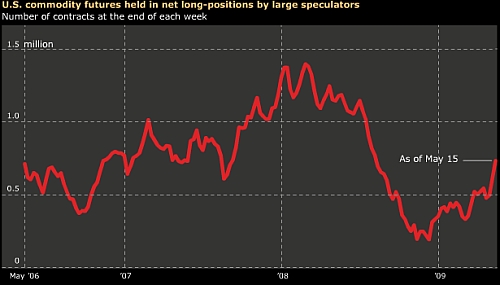
Aside from the very obvious upgrades by the TARP-sponsored Financial houses of anything and everything that even smells like oil and the GE-sponsored 24/7 pump-fest on CNBC, we now have Goldman Sachs this morning telling the sheeple specifically to: "sell Petrobras October $34 put options for $1.95 because a U.S. economic recovery and lower petrochemical supplies will limit declines in the price of oil." What Goldman does not mention is that they were one of the "large speculators" that increased their net long positions in commodities 300% since they got their TARP money. This is just BRILLIANT - take OUR money and invest it in commodities, then pull out all the stops to run oil up 88% where these leveraged investment can pay off 10:1 and then give us our money back early at virtually no cost while keeping the 900% gains for themselves - BRILLIANT!

This is the exact same nonsense pulled by GS and company back when they were flush with cash and they drained the American public dry last year, as is documented here in "What Is Really Going On With The Price Of Crude Oil?" Of course this strategy blew up in their face and we had to bail them out when it collapsed, but not before the American people were forced to spend over $4Bn a day for petroleum products last summer - that’s $800Bn we’ll never see again - enough money to employ 16M US citizens with $50,000 jobs or enough to pay 12 Arab Sheiks and 1,000 Wall Street bonuses. Guess what they chose and guess what they are choosing again? It was also enough money to destabilize the balance of trade, throw this country into massive debt, crash the housing market and (in the one positive outcome) finally threw the Republicans out of power. Are the Democrats about to prove that they are no better? Can the same nonsense really go on less than one year after we "learned our lesson"?

Even the Libya’s Oil Minister believes there is no fundamental support for these prices, saying: "Prices are moving because the speculators are back. Fundamentals do not tally with psychology." That is certainly backed up by this week’s Petroleum Status Report, which had the very interesting statement: "Total products supplied over the last four-week period has averaged nearly 18.3 million barrels per day, down by 7.3 percent compared to the similar period last year." That’s right, the US Oil Cartel produced 1.5M barrrels LESS per day than last year, creating a 10.5Mb product deficit on the busiest week of the year. Not only that but imports were down 650,000 barrels a day, shorting the US another 4.5Mb of oil for the week. This data is for the week that ended Friday, May 22nd - a week when massive amounts of fuel are transferred to retail gas stations who get ready for the biggest driving weekend of the year and despite having the head start of a 15Mb shortfall in supply, the total drawdown of product was just 5.4Mb for the week. Imagine how much oil we’d be swimming in if we didn’t EXPORT over 1.8Mb PER DAY (12.6Mb/week):

4-Week Avg U.S. Total Crude Oil and Petroleum Products Exports  (Thousand Barrels per Day)

And this nation is, in fact, swimming in oil, despite the fact that speculators like GS are paying to store oil in tankers offshore and around the world in order to create the impression there is more demand than there is in this slumping global economy. We discussed this obscene practice before but it has gotten so out of hand that it now threatens to destabilize the global oil markets and Iraqi Oil Minister (hey, wasn’t that supposed to be OUR oil?), Hussain (no relation?) al-Shahristani said last week: "We don’t think it’s a wise economic decision to produce oil from secure underground fields and then pay to store it in floating tankers. Future generations can benefit from it better than we can, if we don’t need it." The suppliers KNOW they are selling us more oil than we need and they KNOW the speculators are sitting on it, the only people who don’t seem to know what’s going on here is the Obama administration and the American people who are being conned out of 16M jobs worth of money again by the same bastards we had to bail out when their last con game got busted.

That is how, using our bail-out money, the price of oil has been driven up 88% in 6 months and it will go up another 88% if this Administration is going to act as deaf, dumb and blind as the last Administration while the American people are robbed blind with over $600Bn global consumer dollars being sucked out of the economy with every $10 increase in the price of crude. We are at a 25-year high in petroleum storage in the US and we have 139M barrels more in storage than last year - an average increase of nearly 3M barrels a WEEK despite OPEC’s 29Mb/week production cut. Reuters reports that there is a "floating oil lake" that "is now so big that it is likely to keep a lid on prices for some time" as the volume of oil stored at sea has risen to record levels.

Reuters points out that the last time floating oil stock levels were anywhere near these levels was in the early 1990s after the first Gulf war. Tanks were drained then into a rising market and traders and analysts say only a rise in demand will clear the stocks now. But there is little chance of a quick recovery in oil use as the world faces its worst recession since World War Two, and the massive floating oil inventory is now haunting the market, an extra source of supply at a time when demand is extremely weak. "Out of the market and off balance sheet, everyone knows about this oil but is trying not to think about it," said Simon Wardell, director of oil research at IHS Global Insight. "It is deferred supply, an almost ethereal source of oil waiting offshore. As long as it is unused, it is effectively acting as a support for the market, but at some point it will reappear so it is acting as a ceiling on oil prices."

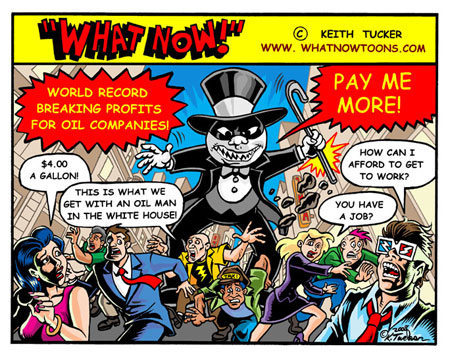
Of course, there are other players besides Goldman Sachs reaping huge cash rewards as they put the screws to the good people of the United States. BP’s trading operations reported that Q1 "trading profit was about $500 million higher than what we would consider the normal range of quarterly volatility.” VLO reported $150M in "profits related to trading," RDS.A’s CFO, Peter Voser was proud to report: "We have used some working capital actually to drive trading during the first quarter, and to a certain extent also into the second quarter" and HES said: "winning bets by its trading desk during the first quarter helped cushion the blow from $5 million in weekly losses on oil and natural-gas production, the company’s traders generated a $19 million profit in the January-to-March period." MRO, the fourth-largest U.S. oil company, also benefited from the trade: “A very small amount of crude was put in tankage for contango purposes,” said SVP, Garry Peiffer. In contrast, Chevron Corp., the second-largest U.S. oil company said a scale-back in trading contributed to a 99 percent drop in its U.S. oil and natural-gas profits. Chevron reduced its use of derivative contracts such as futures contracts and swaps to lock in margins by an undisclosed amount during the first quarter, spokesman Jim Aleveras said during a conference call with investors and analysts.

So Pete Rose is banned from baseball for life for betting on games but we not only reward the energy producers that bet the energy prices charged to US Citizens will go higher but we punish the ones who choose not to participate. This is a rigged system and only government action will ever change it. What’s really sad here is that all of these bastards are just skimming profits off the barrels and those come in from overseas so it costs the citizens of the United States close to $1Tn of hard earned cash that literally goes up in smoke in order for the Big Oil/Big Broker Cartel to make $100Bn. It’s not an efficient system - it would be much cheaper for us if we just hand them their money or perhaps start lobbying for real change to stop this madness. I am making this article free so feel free to send it to whoever you can - this is a serious issue that needs to be addressed before it’s too late to save us.

We’ll find out shortly to what extent the GDP supports any of the 88% rise in oil prices since Q4. I don’t suppose we’ll have an 88% rise in GDP - in fact, they are expecting a 5.5% decline but that would be a 0.6% improvement from the preliminary reading of -6.1% so the global markets are partying in anticipation of this blessed event. Oh here it is: Down 5.7%! That’s a little disappointing but I think there has been such a massive effort to get the markets up this month that I can’t imagine they’ll let it go on the last day but there is NO WAY I would go into this weekend bullish. It is likely we zig-zag into a finish around 8,412 on the Dow and 908 on the S&P and I’m not expecting the kind of wild moves that we got yesterday.

As with yesterday though, absolutely anything can happen and we remain mainly in cash but I will be scaling into yesterday’s oil shorts, painful though it may be. We expect a top at $70 (100% up from $35) and a 20% pullback to $63 so scaling in at $63 (yesterday), $66 (today) and $70 is the plan we are following. If we ultimately get blown out and take a 20-25% loss on this round (if oil flies through $70 and we stop out), then the plan is to wait for $100 and try again! Can the oil markets once again remain irrational longer than the nation can remain solvent? We will find out this summer for sure

Meanwhile the dollar is being crushed, falling to $1.41.5 to the Euro and $161.5 to the Pound and back to 95.5 Yen in one horrible morning’s trading. Of course currency speculation is not much different than commodity speculation and when you are a big investment bank and can control both at the same time - well that is just a home run play! Gold is flying up to $980 and oil is hitting our $66 target this morning. Just in case you thought your stocks were doing well, here is the performance of the S&P priced in barrels of oil. Depressing isn’t it? In fact, if you are well indexed to the S&P, your holdings buy 33% less oil today than they did on Jan 1st. For many Arab nations, of course, they see the opposite as they have gained 33% against us in the first half of the year. Priced in gold, the S&P is only down 15% this year, but in a very ugly downtrend and in Euros we’re only down 8% so yay, I guess…

Asian markets were up about 1.5% this morning (China was still closed) led, of course, by commodity stocks as well as Japan enacting an EXTRA $143Bn stimulus plan. India’s GDP came in at 5.8% vs. 5% expected and I’ll be doing a global overview this weekend so we’ll save that discussion. Europe is also up 1.5% ahead of our open but the DAX did not take our GDP well and turned sharply down off 5,000 (9am) so we’ll have to see how things play out over there. Europe is also being led higher by energy stocks, which are also leading the US indexes with 12% gains on the month, accounting for 100% of the 3% gains the indexes have put up - it would be a real shame if they do sell off so please be careful out there!

Sphere: Related Content

Robert Rodriguez On The Economy

Now and then there is a glitch in the matrix, and one can actually find something useful in that massive propaganda machine known as CNBC (all hail General Electric and the upcoming US nationalization of every deteriorating corporation). Presented below is an interview with Robert Rodriguez, CEO of First Pacific Advisors and Morningstar Fixed Income Fund Manager for 2008, which is quite impressive, not least in that CNBC allowed this segment to air at all, but because Rodriguez captures the essence of the collision course in which the economy is headed.
"People do know that we are in trouble and that we have to go down a different course. The question is which course and we have a course in this country right now of excessive debt growth and liability growth, and there is a group of people that realize this is a non-sustainable course that's dangerous to the country, the economy and to their children."
Sphere: Related Content

300 Million Shorts Covered In Russell 3,000 During First Half Of May

TrimTabs reporting that in the first half of May (May 1-15), short interest on the Russell 3,000 stocks dropped to 13.32 billion shares ($253 billion / 2.78% of market cap) from 13.62 billion shares ($260 billion / 2.88% of market cap) on April 30.

There was net short covering in eight of the ten major sectors with Financials and Information Technology receiving the largest short interest outflows of $2.9 billion and $2.0 billion, respectively. The only sectors with net short selling were Energy and Industrials, in which traders opened new short positions valued at $500 million and $169 million, respectively.


Sphere: Related Content

Dollar Beatdown Ramping Up

Carry traders have called it a day and are now all congregating at Flashdancers.

Sphere: Related Content

Mortgage Spread Stubbornly Flat

The green shoot police will have a field day beating the drum over how the 30 Year mortgage has massively tightened to the 10 Year.... by a whopping 0.04 bps.

Sphere: Related Content

JPM And Bank Of America Pay Themselves Back In Yet Another REIT Offering

In the most recent example of taking from one pocket to pay another, Merrill and JPM underwrote 8.75 million shares at $20/share for Kilroy Realty Corp, a REIT that owns, operates, develops, and acquires Class-A suburban office and industrial real estate in bankrupt southern California. But don't bother Cohen and Steers with the fundamentals - after all not only are REITs the primary recipient of taxpayer subsidies via the PPIP pumpage of CMBS, now Arnie is making sure taxpayers double dip, and bail out his state as well. As such, for taxpayers going long a REIT debacle such as KRC makes all the sense: at the end of the day the choice is either paying yourself in advance on April 15 by buying the worst garbage Wall Street has to offer, or not paying taxes at all.

And, in a much maligned but extremely profitable tradition, all the offering proceeds of $166.7 million, will go to pay back Merrill's revolver with KRC. Everyone is eagerly awaiting the upgrades to buy yet another stock which will soon have negative FFO after all California tenants which are not too big to fail stop paying their rents.

But before we get the inevitable Strong Buy boost from the revolver repayment beneficiaries, here is an objective summary analysis of KRC compliments of Dan Amoss of Strategic Short Report:
Kilroy’s 92 office buildings and 42 industrial buildings are located in Los Angeles, Orange, and San Diego counties. The occupancy rate of Kilroy’s 12.4 million square feet of total rentable space was just 89.2% at December 2008, down from 94% in 2007. This is an important metric because not only are many of Kilroy’s tenants in businesses like mortgage sales going away permanently, but healthy tenants are gaining the upper hand in lease renewal negotiations.

Demand for office space tends to lag employment trends. The dramatic recent jump to 10.5% in California’s unemployment rate will make Kilroy’s 2009 and 2010 lease renegotiations very unpleasant. The fact that California’s state government is insolvent doesn’t help Kilroy’s lease renewal efforts. The state will likely impose higher taxes and fees on businesses to balance its budget, driving many more out of the state to havens like Nevada.

Kilroy’s tenant profile is diversified across industries, but is 85% concentrated in the following industries: professional services (34%), manufacturing (19%), education and health services (17%), and financial and real estate services (15%). Its top 15 tenants by size contributed 39% of 2008 revenue. Lease expirations are a significant risk for Kilroy shareholders, because the tenants that do renew in 2009 and 2010 will do so at steadily lower rents. Kilroy’s 10-K discloses lease information that paints an ugly picture for shareholders. In addition to the 10.8% of Kilroy’s square footage that lies vacant, leases representing another 8% and 15% of Kilroy’s 2008 revenue will expire in 2009 and 2010, respectively (see blue line in nearby chart). Yet another obscure metric shows how much Kilroy’s space is underutilized: 3.9% of Kilroy’s currently leased space is available for sublease.

Let’s take a quick look at one of Kilroy’s tenants. Bridgepoint Education is a for-profit education company that accounts for 3.5% of Kilroy’s 2008 rental revenue. It is expected to become Kilroy’s second-largest tenant by this fall if it follows through on commitments to take more office space. Bridgepoint just completed its initial public offering and trades on the NYSE under the symbol BPI. Bridgepoint is “me too” stock — one of a long list of for-profit online colleges that look to serve the interests of insiders more than students. Famed short seller Jim Chanos has gone public with the disclosure that he is short most of the for-profit education companies. Chanos considers the business model to be unsustainable, and I agree with his assessment.

Bridgepoint’s IPO looks rushed. Insiders and private equity backer Warburg Pincus probably wanted to cash out before the Dept. of Education cracks down on abuses of Title IV education funding — likely to come later in 2009. The risk factors in Bridgepoint’s SEC filings make for entertaining reading. I’ll keep an eye on Bridgepoint, because the potential loss of this tenant is a hidden risk in Kilroy’s fundamentals.


Kilroy's Debt Load Is the Biggest Risk

The biggest risk for KRC stock is the leverage on its balance sheet. Kilroy has $1.4 billion in total debt, preferred stock, and minority interest — a good portion of it built up during the office construction and renovation boom. The green line in the nearby chart was drawn from data in Kilroy’s cash flow statements going back 10 years (courtesy of CreditRiskMonitor). It is a proxy for Kilroy’s annual investment in its real estate portfolio: capital investment plus acquisitions minus divestitures — all as a percentage of total property book value. As you can see, Kilroy invested pretty heavily in 2006 and 2007, and the return on those investments is going to be disappointing.

Covenant Risk Growing Larger

Kilroy’s capital structure is roughly 72% debt, if you measure it as total debt and preferred stock (the red columns in the chart) as a percentage of the book value of real estate (the black columns in the chart). But the market value of Kilroy’s real estate will likely be lower than book value in coming years. Kilroy may have to impair the value of its underperforming properties fairly soon. According to its 10-K, the following indicators determine whether a write-down of property value may be necessary: “Significant increases in market capitalization rates, continuous increases in market capitalization rates over several quarters, or recent property sales at a loss within a given submarket, each of which could signal a decrease in the market value of properties” [emphasis added].

Write-downs would not be good for Kilroy’s coverage of its debt covenants — one of which hinges on total debt to total asset value. But the most immediate covenant in danger of violation is a minimum occupancy requirement for Kilroy’s unencumbered assets: This must be least 85%. As of year-end 2008, this figure was 92% and will head lower in 2009.

Kilroy Must Meet Daunting Obligations Over Next 2 Years

Kilroy’s $1.4 billion in secured debt, unsecured debt, preferred stock, and minority interest is roughly twice the $700 million market value of its common stock. Kilroy must fund roughly $625 million in contractual payments by the end of 2011, which includes principal and interest payments on its debt (see chart above). It will have to fund this through some combination of funds from operation, refinancing, asset sales, or secondary equity offerings.

Let’s consider how much free cash flow Kilroy can generate in 2009, 2010, and 2011. My generous estimate of total funds from operation for these three years, adjusted for the capital expenditures necessary to merely maintain its properties, is roughly $230 million. But this doesn’t include the dividend payments Kilroy must pay to its shareholders to maintain its REIT status. If Kilroy maintains its current dividend, the cash outflow over these three years will be $240 million.

This lack of free cash flow to pay down debt will force Kilroy into a scenario that destroys shareholder value. All forms of debt financing for REITs is getting much more expensive, simply because demand for credit is overwhelming and supply of credit from banks is scarce and expensive. The weighted average interest rate on Kilroy’s debt was just 4.8% in 2008. This ultra-low interest rate is a symptom of the poor underwriting standards during the commercial real estate lending bubble.

Interest rates will soar for any REIT looking to refinance unsecured debt. For example, Simon Property Group — the biggest mall REIT in the U.S. — recently issued $650 million in 10-year senior notes at 10.35%. If Simon had to pay that much for long-term financing, then the rest of the industry is in serious trouble.

Kilroy’s weighted average interest rate could easily double by the end of 2011, which would transfer much of its future rental cash flow from shareholders to creditors.

Property Sales Would Be Self-Defeating for Kilroy Shareholders

If Kilroy considers asset sales, this option would be selfdefeating. It may have to sell properties at lower values than it is carrying them on its books. Maguire Properties will be a distressed seller in Kilroy’s neighborhood, depressing property prices. Maguire has earned the distinction of having made some of the dumbest commercial real estate purchases at the peak of the bubble. Bloomberg describes one of Maguire’s recent sales:
“Maguire Properties paid $2.88 billion in 2007 for 24 office properties and 11 development sites. The purchase, from Blackstone Group LP, encompassed all of the real estate in downtown Los Angeles and Orange County that Blackstone acquired in its acquisition of Equity Office Properties Trust. The purchase came just as Orange County vacancies were rising with the collapse of the subprime mortgage industry. The subsequent credit market freeze blocked Maguire’s efforts to refinance...

“Maguire last month sold its 18581 Teller office building in Irvine for $22 million, including the buyer’s assumption of a $20 million mortgage on the property. The property was one of those purchased from Blackstone.”
What does Maguire’s office building sale mean for Kilroy? It’s just two miles away from an empty industrial building on Von Karman Avenue that Kilroy is in the process of re-entitling for residential use. This is just one example of the risk facing Kilroy’s property values.

Kilroy will likely follow in the footsteps of its strapped REIT peers and pay most of its dividends through 2011 in the form of shares, rather than cash. Kilroy management mentioned the possibility of paying the dividend in stock on its last conference call. Recent IRS guidance allows Kilroy to maintain its REIT status if it satisfies up to 90% of its dividend requirement through the distribution of new shares, rather than cash.
But this is all data, that Cohen and Steers, and all who likely bought into KRC's offering are well aware of. Plus who cares, as ML is expediently running up the stock and completely groundless upcoming upgrades are merely days if not hours away. It is now becoming crystal clear why Sakwa decided to call it a day.

Disclosure: no position in KRC securities. Sphere: Related Content

Daily Highlights: 5.29.09

  • Asian stocks edge higher after Japan industrial production posts biggest gain in 56 years.
  • Dollar weakens as stock gains increase demand for higher yields.
  • Fed officials believe the recent sharp rise in Treasury yields could reflect a mending economy.
  • India’s economy expands 5.8 percent in the three months to March 31, led by government spending and construction.
  • Japan's industrial output jumps at fastest rate in 56 years, but joblessness also rises.
  • Oil dips below $65 in Asia after hitting 6-month high on improving US economy.
  • Treasuries falls as Obama’s record borrowing spree overwhelms Federal Reserve efforts to cap consumer interest rates.
  • AOL is now worth half as much as Facebook Inc. and less than 5 percent of Google Inc.
  • BofA offers to swap $2B Preferred for common shares to meet capital goal.
  • Chrysler CEO sees sale to Italy's Fiat closing Friday, but dissenters could force postponement.
  • Costco Wholesale's Q3 net falls 29% to $209.6M; revs fell 4.9% to $15.81B.
  • Dell qtrly net down 63% to $290M as revs dipped 23% to $12.34B. warns PC market hasn't hit bottom.
  • FiberNet Telecom to be acquired by Zayo Group for $11.45/sh cash.
  • Ford sold $1.1B of five-year notes through its finance unit to boost cash.
  • GM will file for bankruptcy on June 1; accord reached with some bondholders.
  • HJ Heinz's Q4 net drops 10% to $175M, hurt by a decline in US restaurant traffic.
  • Marvell reports in-line, Q1 EPS at $0.05. Revs up 1.7% at $521.4M.
  • PepsiCo Inc. plays a role in denying $16 million in stock awards for directors of its biggest bottler and withheld support for most of its directors.
  • Revlon implements worldwide org restructuring; says 2Q09 outlook significantly below 2Q08.
  • RH Donnelley files for bankruptcy.
  • Time Warner said it will finally split off its AOL division.
  • Visteon confirmed it filed for Ch 11 bankruptcy protection.
Economic Calendar: Data on GDP, Chicago PMI, Mich Sentiment-Rev to be released today.

Earnings Calendar: GHM, GLNG, MAD, NBG, QSII, RY, TIF.

Companies to watch: BofA, Dell, Ford, GM, Revlon, Royal Bank Of Canada, Tiffany & Co.,
Time Warner.

Recent Egan Jones Rating Actions:

VISTEON CORP (VSTN)
AUTOZONE INC (AZO)
ARVINMERITOR INC (ARM)
ALLEGHENY TECHNOLOGIES INC (ATI)
KEYCORP (KEY)
STAPLES INC (SPLS)
HORMEL FOODS CORP (HRL)
GOODYEAR TIRE & RUBBER CO/THE (GT)
GENERAL MOTORS CORP (GM)
RADIOSHACK CORP (RSH)
CON-WAY INC (CNW)
YRC WORLDWIDE INC (YRCW)
SUNTRUST BANKS INC (STI)

Data from Egan Jones Sphere: Related Content

Frontrunning: May 29

  • GDP dips at 5.7%, more than 5.5% consensus (AP)
  • Good overview of black mortgage Wednesday (MND)
  • Fiat will not attend Open talks (BBC)
  • Tiffany's profit tumbles 62%, sales below consensus (Bloomberg)
  • Oil and gold surge higher (FT)
  • Mortgage rates: it could be as bad as you imagine (Field Check Group)
  • A stimulus you can believe in (The American)
  • Krugman: The big inflation scare (NYT)
  • A brief incursion into the not so big two (WaPo)
  • Bloated US consumer unfit for recovery marathon (Bloomberg)
  • Orwellian headline on the day: Stocks, Oil, Metals Rise as World Recession Eases; Dollar Drops (Bloomberg)


Sphere: Related Content

Thursday, May 28, 2009

Daily Credit Market Summary: May 28 - IG Overdone To Charbroiled

Spreads were tighter in the US as all the indices improved (as IG saw its tightest close in Series 12). Indices generally outperformed intrinsics (as it seemed index flows were getting ahead of themselves into the close) with skews widening in general as IG's skew decompressed as the index beat intrinsics, HVOL outperformed but widened the skew, ExHVOL outperformed pushing the skew wider, XO's skew increased as the index outperformed, and HY outperformed but narrowed the skew.

The names having the largest impact on IG are American International Group, Inc. (-47.87bps) pushing IG 0.21bps tighter, and Textron Financial Corp (+10.1bps) adding 0.08bps to IG. HVOL is more sensitive with American International Group, Inc. pushing it 0.95bps tighter, and Textron Financial Corp contributing 0.34bps to HVOL's change today. The less volatile ExHVOL's move today is driven by both National Rural Utilities Cooperative Finance Corporation (-20bps) pushing the index 0.2bps tighter, and AT&T Inc. (+3bps) adding 0.03bps to ExHVOL.

The price of investment grade credit rose 0.24% to around 98.23% of par, while the price of high yield credits rose 0.745% to around 80.38% of par. ABX market prices are lower by 0.71% of par or in absolute terms, 1.81%. Broadly speaking, CMBX market prices are lower (deteriorating) by 0.06% of par or in absolute terms, 0.02%. Volatility (VIX) is down -0.69pts to 31.67%, with 10Y TSY rallying (yield falling) 12.8bps to 3.61% and the 2s10s curve flattened by 11.2bps, as the cost of protection on US Treasuries rose 2.75bps to 47bps. 2Y swap spreads tightened 2.3bps to 41bps, as the TED Spread widened by 1.3bps to 0.53% and Libor-OIS improved 0bps to 46.2bps.

The Dollar weakened with DXY falling 0.39% to 80.455, Oil rising $1.25 to $64.7 (outperforming the dollar as the value of Oil (rebased to the value of gold) rose by 0.85% today (a 1.58% rise in the relative (dollar adjusted) value of a barrel of oil), and Gold increasing $10.55 to $960.45 as the S&P rallies (905.1 1.41%) outperforming IG credits (141.5bps 0.24%) while IG, which opened tighter at 147bps, underperforms HY credits. IG11 and XOver11 are -1.38bps and +6bps respectively while ITRX11 is +2.75bps to 124.25bps.

The majority of credit curves steepened as the vol term structure steepened with VIX/VIXV decreasing implying a more bearish/more volatile short-term outlook (normally indicative of short-term spread decompression expectations).

Dispersion fell -3.3bps in IG. Broad market dispersion is a little greater than historically expected given current spread levels, indicating more general discrimination among credits than on average over the past year, and dispersion increasing more than expected today indicating a less systemic and more idiosyncratic spread widening/tightening at the tails.

Only 27% of IG credits are shifting by more than 3bps (which is around half typical) and 39% of the CDX universe are also shifting significantly (less than the 5 day average of 47%). The number of names wider than the index increased by 1 to 40 as the day's range fell to 8bps (one-week average 8.85bps), between low bid at 140.5 and high offer at 148.5 and higher beta credits (-0.99%) underperformed lower beta credits (-1.34%).

In IG, wideners were outpaced by tighteners by around 5-to-4, with only 21 credits notably wider. By sector, CONS saw 11% names wider, ENRGs 19% names wider, FINLs 24% names wider, INDUs 18% names wider, and TMTs 17% names wider. Focusing on non-financials, Europe (ITRX Main exFINLS) underperformed US (IG12 exFINLs) with the former trading at 124.81bps and the latter at 116.18bps.

Cross Market, we are seeing the HY-XOver spread compressing to 360.57bps from 394.99bps, and remains below the short-term average of 377.18bps, with the HY/XOver ratio falling to 1.48x, below its 5-day mean of 1.5x. The IG-Main spread compressed to 17.25bps from 25.63bps, and remains below the short-term average of 21.95bps, with the IG/Main ratio falling to 1.14x, below its 5-day mean of 1.18x.

In the US, non-financials outperformed financials as IG ExFINLs are tighter by 1.4bps to 116.2bps, with 54 of the 104 names tighter. while among US Financials, the CDR Counterparty Risk Index rose 2.75bps to 152.66bps, with Banks (worst) wider by 2.39bps to 183.54bps, Finance names (best) tighter by 0.49bps to 694.04bps, and Brokers wider by 2.19bps to 184.58bps. Monolines are trading wider on average by 12.44bps (0.52%) to 2509.45bps.

In IG, FINLs underperformed non-FINLs (0.76% tighter to 1.2% tighter respectively), with the former (IG FINLs) tighter by 2.6bps to 333.6bps, with 10 of the 21 names tighter. The IG CDS market (as per CDX) is 16.9bps cheap (we'd expect LQD to underperform TLH) to the LQD-TLH-implied valuation of investment grade credit (124.57bps), with the bond ETFs underperforming the IG CDS market by around 10.12bps.

In Europe, ITRX Main ex-FINLs (underperforming FINLs) widened 3.06bps to 124.81bps (with ITRX FINLs -trading sideways- weaker by 1.5 to 122bps) and is currently trading in the middle of the week's range at 43.34%, between 128.81 to 121.75bps, and is trending tighter. Main LoVOL (sideways trading) is currently trading at the wides of the week's range at 97.82%, between 86.93 to 82.29bps. ExHVOL outperformed LoVOL as the differential compressed to -3.28bps from 6.25bps, and remains below the short-term average of 1.4bps. The Main exFINLS to IG ExHVOL differential decompressed to 41.26bps from 33bps, and remains above the short-term average of 38.76bps.

Commentary provided by www.creditresearch.com

Index/Intrinsics Changes

CDR LQD 50 NAIG091 -1.15bps to 170.95 (12 wider - 30 tighter <> 30 steeper - 18 flatter).

CDX12 IG -5.63bps to 141.5 ($0.24 to $98.23) (FV -1.59bps to 150.81) (22 wider - 65 tighter <> 78 steeper - 46 flatter) - Trend Tighter.

CDX12 HVOL -7bps to 325 (FV -2.4bps to 376.24) (8 wider - 12 tighter <> 15 steeper - 15 flatter) - Trend Tighter.

CDX12 ExHVOL -5.2bps to 83.55 (FV -1.35bps to 86.72) (14 wider - 81 tighter <> 32 steeper - 63 flatter).

CDX11 XO -1.1bps to 322 (FV +1.69bps to 417.86) (19 wider - 10 tighter <> 14 steeper - 20 flatter) - Trend Tighter.

CDX12 HY (30% recovery) Px $+0.75 to $80.375 / -28.4bps to 1105.1 (FV +14.58bps to 993.47) (50 wider - 36 tighter <> 44 steeper - 45 flatter) - Trend Tighter.

LCDX12 (65% recovery) Px $+0.33 to $80.9 / -19.93bps to 968.12 - Trend Tighter.

MCDX12 +1bps to 181bps. - Trend Wider.

CDR Counterparty Risk Index rose 2.89bps (1.93%) to 152.8bps (14 wider - 1 tighter).

CDR Government Risk Index rose 3.43bps (5.43%) to 66.57bps.

DXY weakened 0.39% to 80.46.

Oil rose $1.25 to $64.7.

Gold rose $10.55 to $960.45.

VIX fell 0.69pts to 31.67%.

10Y US Treasury yields fell 12.4bps to 3.62%.

S&P500 Futures gained 1.41% to 905.1. Sphere: Related Content

The Federal Reserve's Open Market Operations

As recently many questions have arisen as to the involvement of the Federal Reserve in bond (and other) markets, I present the data provided by the Federal Reserve of New York regarding the Fed's Open Market Operations. The charts below summarize the individual (single-serving if you will) and cumulative purchases across both Treasuries and Agencies. In a nutshell, for 2009, the Fed has purchased $131 billion Treasuries and $63.8 billion Agencies.

Now if only the Fed would follow in Japan's example and disclose its equity market purchases, there would be no more hard feelings.

Reader Mike points out that these are, in fact, merely agency bullet debentures. These do not include the hundreds of billions of MBS purchased recently, including the $25 billion BMS bought this week.


Sphere: Related Content

Even Bloomberg Openly Ridiculing Tim Geithner Now

For all with access to Bloomberg, run LTRA... For those who don't have bberg handy, here is the screen capture of Bloomberg's perfidious sense of humor.


Judging by the market, Bloomberg is actively developing its next critical "cointoss" function: [PPT] GO. Sphere: Related Content

The SPY - IWM Dislocation

Somebody is really getting reamed by the SPY - IWM hedging dislocation today.

Sphere: Related Content

Some Facts In The GM Propaganda Race

Zero Hedge pointed out how abysmally hilarious CNBC's repetitive conclusion that GM's bankruptcy is a done deal, when you only have 20-35% of the bondholders on deck. True, Rattner will likely make some urgent phone calls, and attempt a gut (and wallet) wrenching appeal to the holdouts, referring to such flights of fancy as the holdout's mother, family, the IRS, the SEC, etc. But even all that does not preclude those who believe they stand a chance of getting a better recovery in liquidation than a 20% warrant upside in a company that has in the past made such utter horrors as the Aztek, in appealing to district and, eventually, supreme court.

In fact, ZH is quite confident that Mr. Lauria is currently contemplating just what the best overtures to the Supreme Court should be for both Chrysler and GM. Whatever these are, the fireworks will hopefully be interesting: luckily Sotomayor is still not up and running.

As for the facts, Dealscape has a great interview with Jeff Marwil of Proskauer who lays it out straight:
"It's not a deal if it's only 20% of the bondholders agree, and it doesn't mean the plan will succeed. It just means the government has support now from some bondholders, and bankruptcy now seems like a foregone conclusion," Marwil explained.

"I think the greatest challenge will be doing it right the first time and emerging from bankruptcy poised for success. Who knows how long the bondholders will fight? This will be the biggest bankruptcy ever so there are a lot of issues to get resolved," he said.
In other news, ZH has it Bowling Green spies reporting, and I hope to bring to our readers the moment when Gonzalez puts Peck to shame with the fastest steamrolling of the bankruptcy process in recorded history. Sphere: Related Content

Mortgage Tankage Accelerates

Equities loving, loving that mortgages jumped by 50 bps over past two days. And the pounding is not ending.

Sphere: Related Content

BankUnited's Power Animal

As if on Zero Hedge's cue BankUnited CEO John Kanas appeared on CNBC today to talk about how wonderfully things are going for the new-lease-on-life firm. The regulators were great! They opened for "business as usual" the next day! No. The rumors that the supply of free toasters has diminished are totally false.

You will be pleased to know that Zero Hedge has managed to dig up quite a bit of interesting history on BankUnited. For instance, we have discovered that BankUnited's power animal is the Black Carpenter Ant (indigenous to Florida and prone to destroy homes).

Look for our updates in the coming weeks.


Sphere: Related Content

Investors Dumping 7 Year Note Ahead Of Auction... And After

2s7s chart below showing just how much tolerance bond vigilantes have for anything with a duration of over 2 years and 1 day. 3 minutes until the 7 year auction results are announced.

Update: Closes at 3.30, 2 cheap to current, 2.26 bid-to-cover, 7 years now dropping.


Update: and it rips


And the 2s10s, back to yesterday's wide. The supplemental liquidity eliminators taking advantage of the total confusion in equities and squeezing equities higher.

Sphere: Related Content

Edscha LCDS Secured Auction Final Price.... 3.75 Cents On Dollar

Never heard of the company, but any time you have a LCDS auction clearing 3.75 @#&$hairs away from zilch, it can't be good, even more so when you end up with zero net open interest. Yes... you read that right... SECURED recovery of 3.75 for a European auto supplier... Bring on the auto green shoots stat.

Sphere: Related Content

Gold Getting Ready For Big Breakout

Yes, the cheap dollar is great, and both Japan and the ECB are looooving it. In the meantime, maybe Paulson and Einhorn are on to something (see below).

Sphere: Related Content

More Chicago Corruption

BNO reports that that the U.S. Attorney's office in Chicago will announce another public corruption case, possibly involving an elected official at 2 p.m. local time today.

Update: Well, it is not someone else people may have been expecting... Instead it is Ike Carrothers, the chairman of the City Council's police and fire committee. Sphere: Related Content

GM To File Bankruptcy On June 1

According to Bloomberg. As expected, Good GM will buy all the good stuff (anyone mind pointing out just what that is), and the garbage (Pontiac Aztek and such) will be thrown away.

Market rallies on the news that 20% of bondholders (the ad hocs) agree with the proposed plan to get warrants in a worthless company. Hm, what about the 80% who do not? Sphere: Related Content

Citi Begging For Taxpayer Crutches Again

After briefly appearing in the critical ward, looks like Citi is back to comatose condition. Having raised $2 billion in 10 year non-guaranteed debt a week ago, the behemoth toxic asset cesspool that Vikram inherited is in the market again... for a TLGP-guaranteed trade. Good to see Citi's observant capital markets strategists know how to gauge the market's receptiveness to their garbage, and also when to hide in the shadow of taxpayer guarantees.
Aaa/AAA/AAA heard in the market with multi-part TLGP trade. Citigroup Funding offering 2y fixed and/or floater (benchmark size); and Citigroup NA offering 3y fixed and/or floater (benchmark size). Citi sole. Pricing asap.
Good to see 9 A's supporting this issue, backed by the full faith and credit of the FDIC's $0 DIF. Also, this presumably means that Citi can replace 3 flat tires for free or something like that. Sphere: Related Content

New York Fed Drowns Hope For Green Shoots In Commercial Real Estate

Til Schuermann, VP of Financial Intermediation at the Federal Reserve Bank of New York, is testifying today on issues in Commercial Real Estate, and his prepared remarks essentially drown the prospect of green shoots in the context of CRE.

The same cannot be said for loan demand. The SLOOS reports that the net fraction of loan officers reporting weaker demand in April 2009 was 60% for C&I and 66% for CRE loans, a historical low for CRE demand. Weak demand bears emphasis, as it indicates that the observed slowdown in overall credit is partly due to firms’ reluctance to borrow, and not entirely to banks reluctance to lend [someone finally pointing out the obivious].

The combination of acute stresses in the financial markets, together with stresses on bank balance sheets, in the middle of the worst recession in a generation, should caution us from believing that recovery is just around the corner.

His full prepared testimony is provided below.

Testimony before the TARP Congressional Oversight Panel, Hearing on Commercial & Industrial and Commercial Real Estate Lending, New York City

Members of the Panel, thank you for giving me the opportunity to discuss with you some of the recent trends in commercial lending, and especially the role banks have played and are playing in the provision of credit to this important sector. My name is Til Schuermann, and I am a vice president of the Federal Reserve Bank of New York. I wish to preface my remarks by noting that they do not reflect the official views of the Federal Reserve Bank of New York or any other component of the Federal Reserve System.

In early 2007, just before the crisis hit, U.S. commercial banks had $10 trillion of assets on their balance sheets. About 60% was composed of what we may think of as traditional banking assets in the form of loans and leases, and of that about $1.2 trillion or 20% was in the form of commercial & industrial (C&I) lending, and about $1.4 trillion or 24% in commercial real estate (CRE) lending, the topics of today’s hearing.1 Meanwhile, the sum total of assets at other important non-bank intermediaries such as finance companies, the government sponsored enterprises (GSEs), investment banks, and—importantly—issuers of securitized non-mortgage assets (such as auto loans, credit card receivables, student and small business loans) was over $16 trillion.

When one adds credit provision though corporate bonds and commercial paper, one realizes that commercial banks have provided only about 20% of total U.S. lending, since the early 90s. The four decades prior had banks’ share closer to 40%. The rise of market-based instead of bank-based credit provision in the last twenty years has been substantial and important.

But banks play a critical role as shock absorbers to the financial system. When times are good, borrowers and investors—i.e., those that need and those that supply funds—seem content to move outside the safety net of the regulated banking system. When a shock hits, however, those investors return to the safety of banks, and firms in turn draw down the loan commitments they have in place for a rainy day. Credit assets such as auto loans, small business loans, credit card receivables and some commercial real estate—once easily securitized and moved off of bank balance sheets into the capital markets—now remain on bank balance sheets and therefore use up scarce lending capacity. In short, banks intermediate when markets don’t or can’t, and what we see is a flight to banks.

At the same time, there is a limit to how much banks can re-intermediate in place of markets, and that limit is typically dictated by capital. Capital is a constraint on banks’ balance sheets, meaning their lending capacity, even in good times. We impose minimum capital standards on banks as a buffer against unexpected losses. Where banks extend credit, regulators and market participants expect that they will have ample capital standing behind those commitments. But during the crisis banks have been confronted with a perfect storm as those very same assets moving onto bank balance sheets, as well as loans and securities already in the banks’ portfolios, face increased risk of credit deterioration and losses, especially if we experience a prolonged and deep recession.

Banks have been playing this role of shock absorber in times of capital market disruption for decades. In this way they helped the markets weather the storm in the fall of 1998 following Russia’s sovereign bond default and the demise of the hedge fund LTCM. And during the dark days of September and October 2008—ten years later—banks faced an unprecedented demand on their balance sheet capacity. By the end of 2008, bank balance sheets had swelled to over $12 trillion (from $10 trillion at the dawn of the crisis).

There are, however, some important differences from 1998, and especially so for C&I and CRE lending. Aside from the obvious and immediate—this financial crisis is far more severe than the turmoil experienced for a few months in the early fall of 1998—we are now in the midst of what many consider to be the worst recession since World War II. We want banks to expand credit, but not at the expense of credit quality. Indeed, lending patterns follow the trends of the overall economy, so that during recessionary times, when demand for credit naturally declines, so does bank lending. It may take some time for bank lending to rebound to pre-recession levels. In the last two recessions, both of which were milder and shorter than the current one, it took at least five years to restore C&I lending to pre-recession levels. The charts that accompany my statement demonstrate this pattern vividly. The first chart shows weekly C&I lending since 1985, with the recession periods shaded in. Lending peaks as one enters the recession and then declines, continuing even after macroeconomic growth resumes. The second chart indexes the same data to 100 at the beginning of the respective recessions and follows lending for five years (or about 250 weeks). In contrast to the previous two recessions, the current recession saw an increase in banks’ C&I balances during the fall of 2008. This reflected onboarding of off-balance sheet assets by banks as well as the drawing down of loan commitments by firms, with the latter effect being especially strong from mid-September to late October of 2008. This ballooning of bank balance sheets exactly reflects the re-intermediation we expect during a time of financial turmoil. It was not until early 2009, one year into the current recession, that we started to see the more typical recessionary pattern of balance sheet decline. But if the previous two recessions are any guide, and to be sure they were milder and shorter than the current one, we may well experience a period of more modest lending at banks before credit demand picks up. This decline will likely be due to a combination of bank capital constraints and reduced market demand for bank loans.

Capital injections, from both private investors and the government, very likely helped significantly in enabling banks to play this important shock absorber role during the current crisis. Not only were banks faced with a sudden and unprecedented demand for balance sheet room, but they were beginning to experience heavy write-downs on loans already made with the prospect of still further write-downs to come. The additional capital raised by the banking system in the course of 2008, and more recently in 2009, has given banks a buffer against future losses, as well as lending headroom that is badly needed in light of the draw-down of commitments that banks have experienced. The result of the recently completed bank stress test has greatly reduced the uncertainty about just how much capital is needed for the largest banks to weather this storm, and to continue to play their credit (re-)intermediation role while capital markets slowly open up again.

The disruption of non-bank lending and investment within the last 18 months has also hit commercial real estate lending hard. Commercial banks have typically provided less than half of the credit consumed by this market. Commercial mortgage backed securities (CMBS) make up about one-quarter of CRE lending, with the rest coming from life insurers, thrifts, GSEs and other financial institutions.2 CMBS issuance has plummeted from over $300 billion in 2007 to under $50 billion in 2008. Banks have picked up some of the slack. So here too, just like in C&I lending, banks are re-intermediating credit where the capital markets have shut.

CRE loans typically have longer maturities, at durations of five or more years, than C&I loans at durations of one to two years. As a result, the pick-up in CRE lending typically lags that of C&I lending as problems surface later and are therefore dealt with more gradually than in faster maturing C&I lending.

Banks cannot pick up all of the slack. Re-invigorating the capital markets to intermediate between the supply and demand for credit is clearly very important. The Federal Reserve’s Term Asset-Backed Securities Loan Facility (TALF) is designed to help with this process by providing financing for the securitization of consumer assets (for example, auto loans, credit cards, student loans and Small Business Administration loans) as well as some CMBS. As a result, spreads in consumer asset securitizations have started to narrow. To be sure, this, like other government programs, is not meant to replace the private markets. Rather, TALF and similar programs are designed to help restart markets by providing some price transparency.

And bankers are starting to see some “green shoots.” The Federal Reserve’s Senior Loan Officer Opinion Survey (SLOOS) suggests that, while the supply of bank credit remains tight, the extent of tightening has abated in recent quarters. One closely watched indicator of banks’ appetite for extending credit is the net percent of loan officers reporting tightening standards for approving new loans. After more than one and a half years of steady tightening, the net percent of loan officers reporting tightening standards for loans to large- and medium-sized firms reached an unprecedented peak of 84% in the fourth quarter of 2008. Since then, however, the net percent tightening has fallen for two consecutive quarters, to 40% in April.3 The tightening in standards for approving CRE loans has also abated, though not so dramatically: the net fraction of lenders reporting tightening standards for CRE dropped from its peak of 87% in the fourth quarter of 2008 to 66% in April 2009. Clearly, the supply of commercial credit remains tight, but just as clearly, the extent of tightening is abating.

The same cannot be said for loan demand. The SLOOS reports that the net fraction of loan officers reporting weaker demand in April 2009 was 60% for C&I and 66% for CRE loans, a historical low for CRE demand. Weak demand bears emphasis, as it indicates that the observed slowdown in overall credit is partly due to firms’ reluctance to borrow, and not entirely to banks reluctance to lend.

In sum, while green shoots may be sprouting in bank lending for commercial purposes—real estate or otherwise—it’s premature to start planning for a harvest. The combination of acute stresses in the financial markets, together with stresses on bank balance sheets, in the middle of the worst recession in a generation, should caution us from believing that recovery is just around the corner.

Thank you for the invitation to appear before you today. I look forward to your questions.

Sphere: Related Content